
Evidence-Driven
Diligence
Silicon to Shareholder
We vet an enterprise end to end, from hardware, firmware, code, and runtime dependencies at the base to the people, knowledge assets, capital sources, and ultimate beneficial owners at the top, using lawfully obtained, commercially available information.
Request a Briefing





Method

How the Work Gets Done
Four steps, applied to every layer of an enterprise and every dependency it stands on.
01
Collect
Agentic AI ingests and structures complex data from curated global sources: any source, any format, any language.

02
Correlate
Multi-source profiles for companies, individuals, technologies, and investors, iteratively enriched through recursive discovery across jurisdictions.

03
Adjudicate
Human-reviewed influence factors reveal multi-layered activity, rather than reducing complex exposure to a single risk score.

04
Monitor
Continuous monitoring extends diligence past the initial snapshot, structured for board, counsel, transaction, and operating decisions.


The unit of analysis is not the machine itself but everything the machine requires: every part, the data inputs, the communications lines, and the knowledge to operate it.
Platform
Clarity Through Intelligence
The nDiligence platform transforms complex data into clear intelligence.
The nDiligence Platform
Instead of raw records, users receive structured dashboards, visualizations, and reports that reveal relationships, highlight risks, and bring hidden insights to the surface. Our products give decision-makers the ability to see their environment from every angle and act with confidence.
Core Intelligence Outputs
The platform organizes data into interactive dashboards, in-depth profiles, network maps, and analytical matrices. Users can pivot across entities, assets, and relationships, uncovering hidden connections and risks. Information is presented visually, allowing analysts to navigate complexity with clarity and precision.

SCVue: The Digital Supply Chain, in Depth
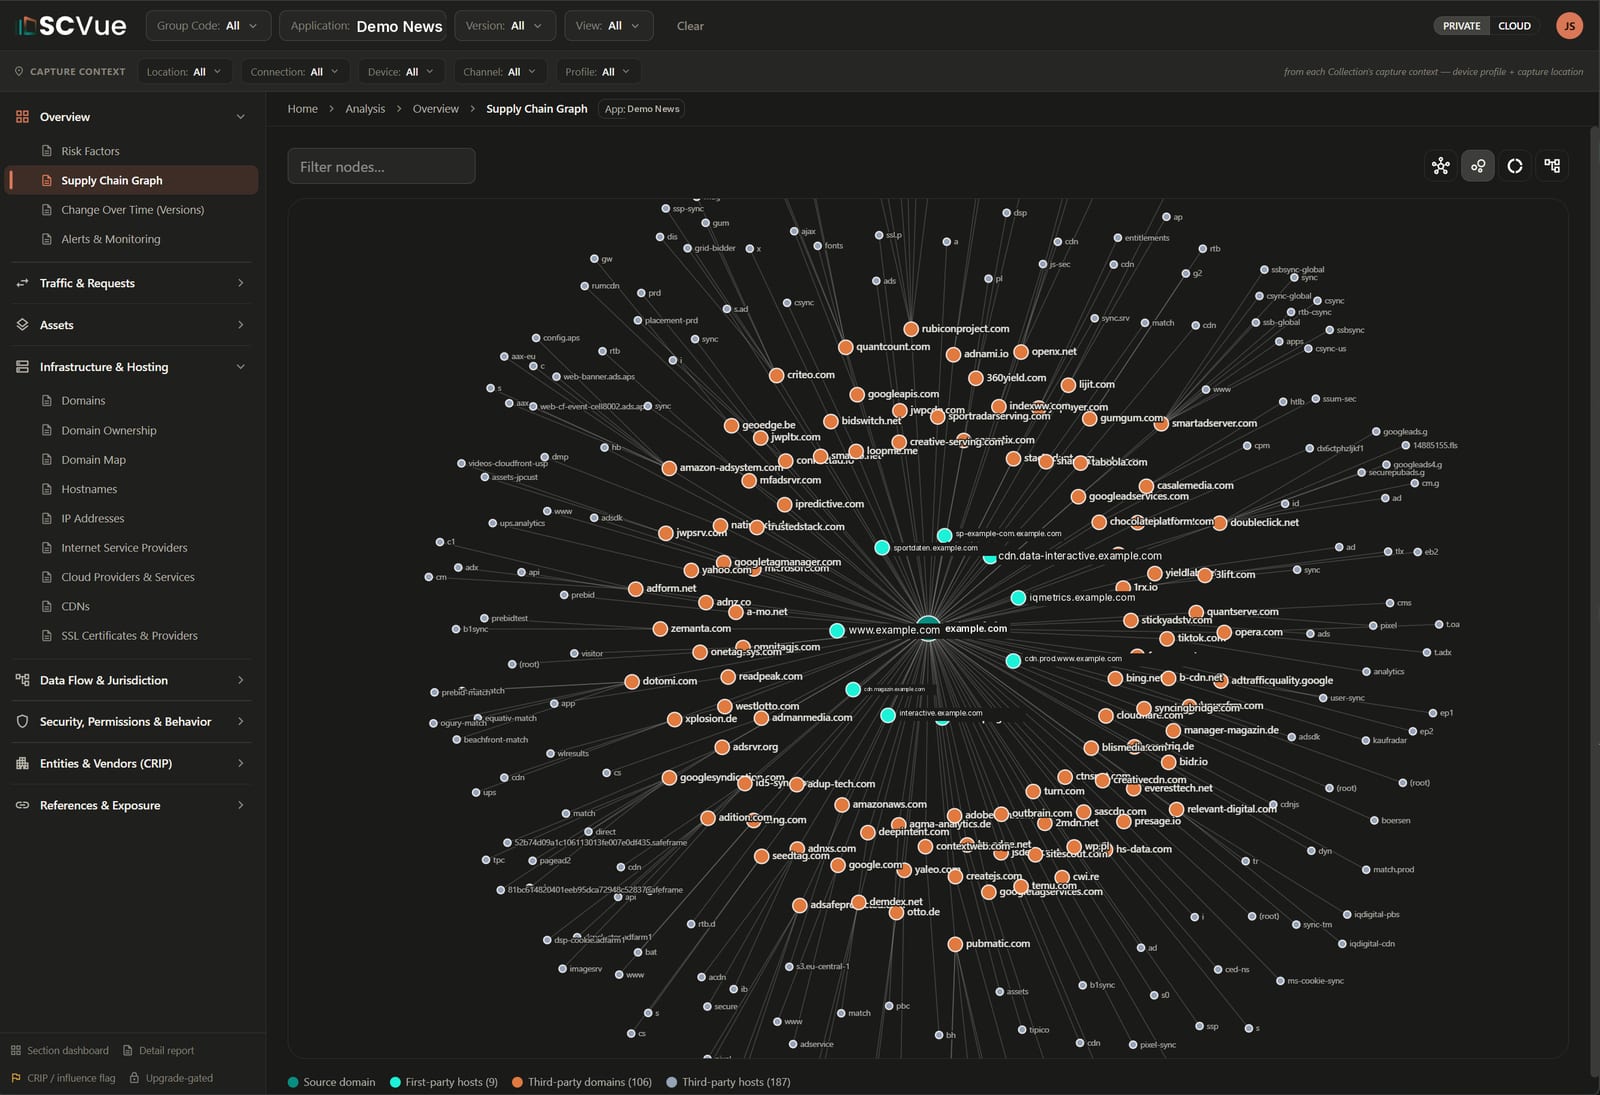
Every application you run is assembled from other people’s software, delivered by other people’s infrastructure, and reporting to other people’s servers. SCVue captures what an application actually loads and where the data actually goes, resolves every observed provider to a real company, and keeps the result under continuous watch. It is how the technology layer of the silicon-to-shareholder picture gets built.

Integration
nDiligence API
The nDiligence API delivers more than raw data. It provides the ability to perform deep, automated research across people, companies, investors, technologies, and supply chains. With flexible endpoints, the API integrates into existing platforms and workflows, enabling continuous diligence at scale.
The API supports selector-based search, allowing enrichment and associations to be built around many pivot points, including individual names, company names, addresses, investors, beneficial owners, founders, employees, domains, IP addresses, hostnames, usernames, and social media accounts. This makes it possible to uncover hidden linkages, map networks, and trace risk across complex ecosystems.
Organizations can also use the API to upload and analyze documents, automatically extracting entities such as people, companies, technologies, and relationships. Advanced capabilities further support forensic analysis of software products across web, mobile, desktop, middleware, IoT, firmware, and other code bases. This helps organizations understand digital supply chains and identify risks in technology products.
The API supports selector-based search, allowing enrichment and associations to be built around many pivot points, including individual names, company names, addresses, investors, beneficial owners, founders, employees, domains, IP addresses, hostnames, usernames, and social media accounts. This makes it possible to uncover hidden linkages, map networks, and trace risk across complex ecosystems.
Organizations can also use the API to upload and analyze documents, automatically extracting entities such as people, companies, technologies, and relationships. Advanced capabilities further support forensic analysis of software products across web, mobile, desktop, middleware, IoT, firmware, and other code bases. This helps organizations understand digital supply chains and identify risks in technology products.
Elements
Profiles and Matrices
nDiligence consolidates complex data into clear profiles and interactive matrices that reveal ownership, relationships, and risks. These visual tools give analysts a complete picture of entities, assets, and connections for faster, more confident decisions.
Company and Vendor Profiles
nDiligence provides comprehensive profiles that consolidate information on companies, vendors, and suppliers. Each profile brings together ownership, leadership, jurisdictions of operation, policies, and affiliations, giving analysts a full picture of who they are dealing with.
Product and Digital Asset Profiles
These profiles reveal the details of technology products, digital assets, and services. Users can see dependencies, integrations, provenance, and potential risks tied to each asset, helping to assess trust and security.
Employee and Investor Profiles
Profiles of employees, founders, executives, and investors connect people to companies, roles, and affiliations. These views highlight influence, governance, and ultimate beneficial ownership to reveal who truly controls or shapes an organization.

Digital Asset Matrix
This visualization shows how digital assets connect to products, companies, developers, and hosting environments. Analysts can identify dependencies, runtime loads, and integrations, along with their associated jurisdictions.

Hosting and Infrastructure Matrix
This matrix reveals hosting locations, IP addresses, domains, and the organizations that control them. By mapping infrastructure across jurisdictions and providers, analysts see the true operational footprint of a platform.

Organization and Entity Maps
Entity maps display the structure of organizations, including leadership, employees with access, investors, and control structures. These maps help visualize governance and uncover hidden relationships across business ecosystems.


Data Flow and Storage Views
Dataflow visualizations track where information is moving, where it is stored, and who controls it. This view highlights risks tied to data sovereignty, third-party access, and compliance obligations.


Equity Chain Mapping
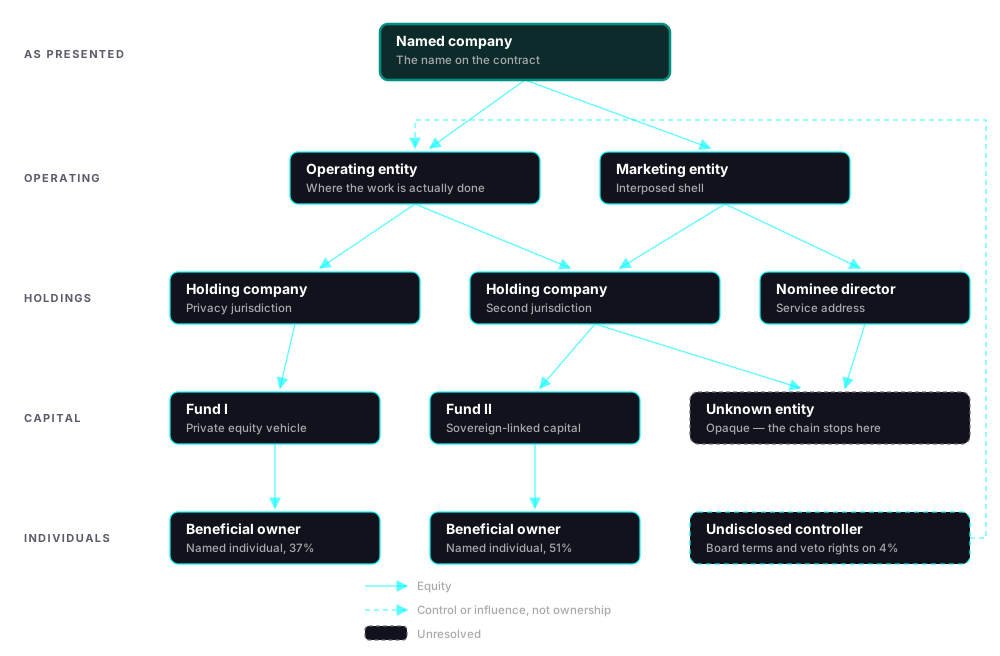
Equity chain maps reveal ownership structures, investors, and affiliations. By connecting corporate filings, financial data, and investor relationships, this visualization highlights hidden risks in corporate ownership. The method behind it resolves an apparent single identity into its actual structure, one node at a time.
See Beyond Data
Why It Matters
nDiligence products do more than display information. They transform scattered records into meaningful intelligence that reveals provenance, control, and influence. Whether assessing digital supply chain integrity, conducting forensic analysis, or mapping corporate ownership, our platform delivers the clarity required for decisive action.
Zero-trust, applied to the supply chain: opacity and unverified dependency are treated as risk conditions, not neutral states. No supplier, platform, or investor is trusted on reputation alone.
Request a
Briefing
We walk through real-world use cases drawn from active engagements that demonstrate why supply chain integrity now requires senior-level attention and coordinated action.

Subscribe to stay informed on global supply chain integrity developments and nDiligence updates.
Copyright © 2026 nDiligence, Inc. All Rights Reserved.